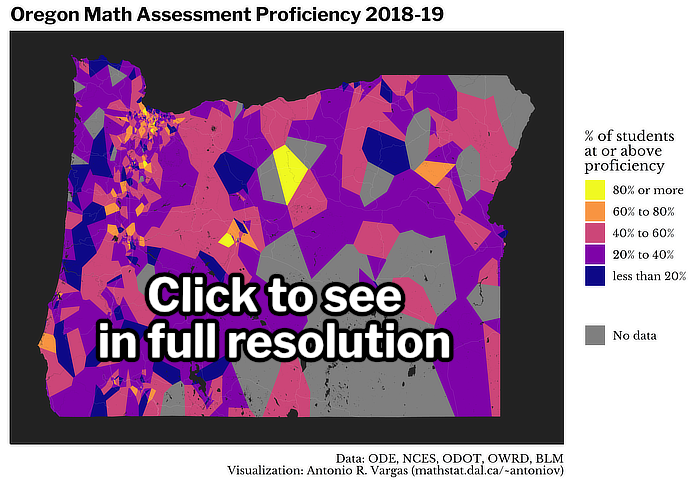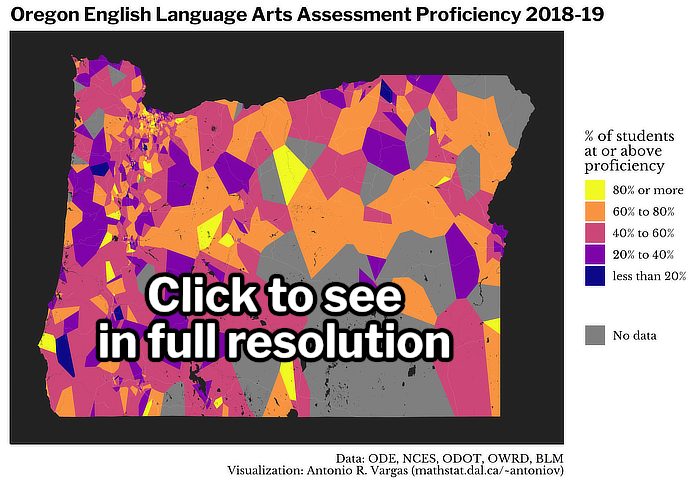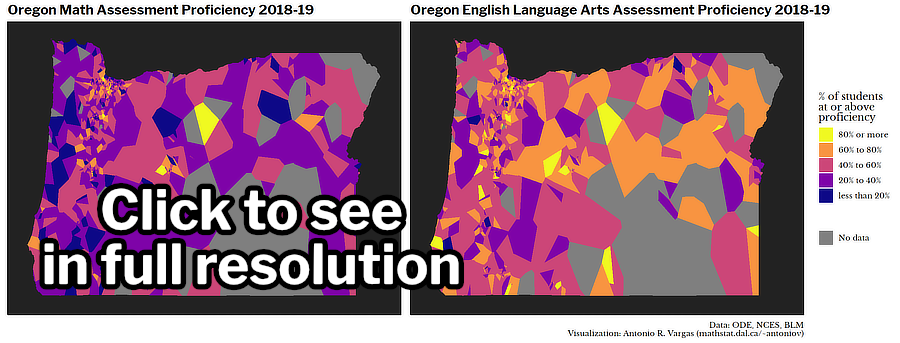

These maps combine data from ODE (proficiency data), NCES (school coordinates), ODOT (locations of highways, freeways, and other signed routes), OWRD (locations of major bodies of water), and the Oregon office of BLM (the outline of Oregon).
How were these maps created?
I made these maps using the R programming language. Click
here to read my writeup of the process. The writeup fully
details how to obtain the raw data and includes complete,
reusable source code for making other maps like these.
Motivation
I created these because I wanted to see the geographic distribution of math & ELA proficiency scores for Oregon's public schools. One way to do that would be to use the school district scores and the school district boundaries from the NCES, but I wanted to do something to visualize the scores of individual schools.
Acknowledgements
I would like to thank Amelia
L. Vargas for her integral contributions. Every
conversation we had made this project better.

