Creating the homelessness in school districts map
Antonio R. Vargas
1 Introduction
This note will detail the process I used to create my map of homelessness in Oregon public school districts. This map shows, for each public school district in Oregon, the percent of students reported to be navigating homelessness during the 2018-2019 school year.
1.1 Software packages and options
We will use the R programming language to process the data and create the maps. Our package list:
# data manipulation
library(openxlsx)
library(dplyr)
library(stringr)

# spatial features
library(sf)

# plotting
library(ggplot2)
library(shadowtext)
library(scales)
library(extrafont)  # we'll use the Verdana font

# options
options(stringsAsFactors = FALSE)
All of these packages are straightforward to install with the exception of extrafont. After installing extrafont for the first time, you must run the command extrafont::font_import() once to load all of your system fonts into the extrafont database. That process can take a while, but you’ll never need to run that command again. Afterward, all of your system fonts will be available in R just by calling library(extrafont) as above.
2 The data: why, what, and how
The final map colors each school district’s area according to the percentage of its students who are reported to be experiencing homelessness. The required data processing mostly involves matching the homelessness statistics published by ODE to the district geographies published by the NCES.
Unfortunately, ODE’s data only identifies districts by name, and these names don’t always match the district names in NCES’s data. One of the files we’ll need to download is a little key I made to match these two sets of names.
We’ll also be adding a handful of city markers to the map for orientation. I used Google Maps to get their rough coordinates and saved them in a separate file.
The code below fetches all of this data from the web and saves it in R’s current working directory so that it can be loaded below.
# school district shapefiles
download.file(
  "https://nces.ed.gov/programs/edge/data/EDGE_SCHOOLDISTRICT_TL19_SY1819.zip",
  "EDGE_SCHOOLDISTRICT_TL19_SY1819.zip"
)
unzip("EDGE_SCHOOLDISTRICT_TL19_SY1819.zip", exdir = "EDGE_SCHOOLDISTRICT_TL19_SY1819")
file.remove("EDGE_SCHOOLDISTRICT_TL19_SY1819.zip")

# percentages of students navigating homelessness
download.file(
  "https://www.oregon.gov/ode/schools-and-districts/grants/ESEA/McKinney-Vento/Documents/Homeless%20Student%20Percentages%20by%20District%2018-19.xlsx",
  "Homeless Student Percentages by District 18-19.xlsx",
  mode = "wb"
)

# NCES district names matched with ODE district names
download.file(
  "https://szego.github.io/districts_homelessness/nces_and_ode_sd_names.csv",
  "nces_and_ode_sd_names.csv",
  mode = "wb"
)

# coordinates of some cities for the map
download.file(
  "https://szego.github.io/districts_homelessness/city_coordinates.csv",
  "city_coordinates.csv",
  mode = "wb"
)
This downloads about 185 MB worth of data. After extracting the archives, the final size of the files is around 292 MB.
2.1 District shapes
Here we load the NCES district data.
districts <-
  st_read("EDGE_SCHOOLDISTRICT_TL19_SY1819") %>%
  filter(
    STATEFP == "41",  # Oregon only
    NAME != "School District Not Defined"
  )
## Reading layer `schooldistrict_sy1819_tl19' from data source `D:\Data\NCES\EDGE_SCHOOLDISTRICT_TL19_SY1819' using driver `ESRI Shapefile'
## Simple feature collection with 13315 features and 18 fields
## geometry type: MULTIPOLYGON
## dimension: XY
## bbox: xmin: -179.1686 ymin: -14.5487 xmax: 179.7487 ymax: 71.38961
## CRS: 4269## Rows: 197
## Columns: 19
## $ STATEFP <chr> "41", "41", "41", "41", "41", "41", "41", "41", "41", "4...
## $ ELSDLEA <chr> NA, "03600", "04170", "04290", "04380", "05020", "05310"...
## $ SCSDLEA <chr> "03630", NA, NA, NA, NA, NA, NA, NA, NA, NA, NA, NA, NA,...
## $ UNSDLEA <chr> NA, NA, NA, NA, NA, NA, NA, NA, NA, NA, "00003", "00014"...
## $ GEOID <chr> "4103630", "4103600", "4104170", "4104290", "4104380", "...
## $ NAME <chr> "Harney County Union High School District 1J", "Harney C...
## $ LSAD <chr> "00", "00", "00", "00", "00", "00", "00", "00", "00", "0...
## $ LOGRADE <chr> "09", "KG", "KG", "KG", "KG", "KG", "KG", "KG", "KG", "K...
## $ HIGRADE <chr> "12", "08", "08", "08", "08", "08", "08", "12", "08", "0...
## $ MTFCC <chr> "G5410", "G5400", "G5400", "G5400", "G5400", "G5400", "G...
## $ SDTYP <chr> NA, NA, NA, NA, NA, NA, NA, NA, NA, NA, NA, NA, NA, NA, ...
## $ FUNCSTAT <chr> "E", "E", "E", "E", "E", "E", "E", "E", "E", "E", "E", "...
## $ ALAND <dbl> 22858014359, 5278048439, 1630525834, 571817653, 97048913...
## $ AWATER <dbl> 238933116, 210793901, 825382, 5759643, 8441028, 3548745,...
## $ INTPTLAT <chr> "+42.9562139", "+43.2518663", "+42.9659106", "+43.299273...
## $ INTPTLON <chr> "-118.9338052", "-118.8745532", "-118.6061945", "-119.28...
## $ GEO_YEAR <chr> "2019", "2019", "2019", "2019", "2019", "2019", "2019", ...
## $ SCHOOLYEAR <chr> "2018-2019", "2018-2019", "2018-2019", "2018-2019", "201...
## $ geometry <MULTIPOLYGON [°]> MULTIPOLYGON (((-118.812 44..., MULTIPOLYGO...2.2 Homelessness statistics
Next we load the homelessness data. Two small changes are made to the district names:1
- We replace “Co.” with “County”.
- We change “Bend-LaPine SD 1” to “Bend-LaPine Administrative SD 1”.
homeless_percents <-
  read.xlsx("Homeless Student Percentages by District 18-19.xlsx") %>%
  mutate(
    District =
      District %>%
      str_replace("Co\\.", "County") %>%
      str_replace("Bend-LaPine SD 1", "Bend-LaPine Administrative SD 1")
  ) %>%
  select(District, Pct.Enrlmt)

homeless_percents %>% arrange(District)
Note that the percentages file does not include all school districts. Missing districts did not indicate that any of their students were homeless. We will fill in these missing zeros below.
2.3 Associating the statistics with the district shapes
Finally we’ll join the percentages to the district shapes using our ODE-NCES district name key.
districts_homelessness <-
  districts %>%
  left_join(read.csv("nces_and_ode_sd_names.csv"), by = c("NAME" = "NCES")) %>%
  left_join(homeless_percents, by = c("ODE" = "District")) %>%
  mutate(Pct.Enrlmt = if_else(is.na(Pct.Enrlmt), 0, Pct.Enrlmt))  # assign 0% homeless
                                                                  # to missing districts

glimpse(districts_homelessness)
## Rows: 197
## Columns: 21
## $ STATEFP <chr> "41", "41", "41", "41", "41", "41", "41", "41", "41", "4...
## $ ELSDLEA <chr> NA, "03600", "04170", "04290", "04380", "05020", "05310"...
## $ SCSDLEA <chr> "03630", NA, NA, NA, NA, NA, NA, NA, NA, NA, NA, NA, NA,...
## $ UNSDLEA <chr> NA, NA, NA, NA, NA, NA, NA, NA, NA, NA, "00003", "00014"...
## $ GEOID <chr> "4103630", "4103600", "4104170", "4104290", "4104380", "...
## $ NAME <chr> "Harney County Union High School District 1J", "Harney C...
## $ LSAD <chr> "00", "00", "00", "00", "00", "00", "00", "00", "00", "0...
## $ LOGRADE <chr> "09", "KG", "KG", "KG", "KG", "KG", "KG", "KG", "KG", "K...
## $ HIGRADE <chr> "12", "08", "08", "08", "08", "08", "08", "12", "08", "0...
## $ MTFCC <chr> "G5410", "G5400", "G5400", "G5400", "G5400", "G5400", "G...
## $ SDTYP <chr> NA, NA, NA, NA, NA, NA, NA, NA, NA, NA, NA, NA, NA, NA, ...
## $ FUNCSTAT <chr> "E", "E", "E", "E", "E", "E", "E", "E", "E", "E", "E", "...
## $ ALAND <dbl> 22858014359, 5278048439, 1630525834, 571817653, 97048913...
## $ AWATER <dbl> 238933116, 210793901, 825382, 5759643, 8441028, 3548745,...
## $ INTPTLAT <chr> "+42.9562139", "+43.2518663", "+42.9659106", "+43.299273...
## $ INTPTLON <chr> "-118.9338052", "-118.8745532", "-118.6061945", "-119.28...
## $ GEO_YEAR <chr> "2019", "2019", "2019", "2019", "2019", "2019", "2019", ...
## $ SCHOOLYEAR <chr> "2018-2019", "2018-2019", "2018-2019", "2018-2019", "201...
## $ ODE <chr> "Harney County Union High SD 1J", "Harney County SD 4", ...
## $ Pct.Enrlmt <dbl> 0.000000000, 0.000000000, 0.000000000, 0.000000000, 0.00...
## $ geometry <MULTIPOLYGON [°]> MULTIPOLYGON (((-118.812 44..., MULTIPOLYGO...This concludes the data processing part of the project.
3 Creating the map
Our map will fill each district area with a color according to its reported percentage of students navigating homelessness. We’ll then add a second layer of dots located at certain cities plus text for the city names.
First we load the city coordinates. Since some of the cities are quite close to each other, we’ll adjust their labels up, down, left, or right so that they don’t overlap.
# A city's name will appear to the right of its dot unless we include
# it in one of these three lists:
cities_left <- c("Ontario", "Jordan Valley")
cities_top <- c("Hillsboro")
cities_bottom <- c("Beaverton")

cities <-
  read.csv("city_coordinates.csv") %>%
  mutate(
    geometry = st_sfc(  # create geographic point objects
      lapply( 1:n(), function(i) st_point(c(long[i], lat[i])) ),
      crs = st_crs(districts_homelessness)
    ),
    name_hjust = case_when(  # used in geom_shadowtext() below
      city %in% cities_left ~ 1,
      (city %in% cities_top) | (city %in% cities_bottom) ~ 0.5,
      TRUE ~ 0
    ),
    name_vjust = case_when(
      city %in% cities_top ~ 0,
      city %in% cities_bottom ~ 1,
      TRUE ~ 0.5
    ),
    name_long_shift = case_when(
      (city %in% cities_top) | (city %in% cities_bottom) ~ 0,
      city %in% cities_left ~ -0.04,
      TRUE ~ 0.04
    ),
    name_lat_shift = case_when(
      city %in% cities_top ~ 0.03,
      city %in% cities_bottom ~ -0.02,
      TRUE ~ 0
    )
  ) %>%
  st_sf()
Finally, here’s the map.
gg_homeless <-
  ggplot() +
  geom_sf(  # add district areas
    data = districts_homelessness,
    aes(fill = Pct.Enrlmt),
    color = "black",
    size = 0.1
  ) +
  geom_sf(  # add city points, black outline
    data = cities,
    color = "black",
    size = 0.35
  ) +
  geom_sf(  # add city points, white center
    data = cities,
    color = "white",
    size = 0.1
  ) +
  geom_shadowtext(  # add city names
    data = cities,
    aes(
      x = long + name_long_shift,
      y = lat + name_lat_shift,
      label = city,
      hjust = name_hjust,
      vjust = name_vjust
    ),
    color = "white",
    bg.colour = "black",
    size = 0.9,
    family = "Verdana"
  ) +
  scale_fill_viridis_c(  # color bar
    name = "% of students\nreported as\nhomeless",
    option = "magma",
    breaks = ((0:6)*5)/100,
    labels = percent_format(accuracy = 1)
  ) +
  theme(  # clean up
    axis.title.x = element_blank(),
    axis.text.x = element_blank(),
    axis.ticks.x = element_blank(),
    axis.title.y = element_blank(),
    axis.text.y = element_blank(),
    axis.ticks.y = element_blank(),
    panel.background = element_rect(fill = "white"),
    legend.key.height = unit(0.15, "npc"),
    legend.key.width = unit(0.05, "npc"),
    plot.title = element_text(hjust = 0.5),
    plot.caption = element_text(hjust = 0),
    text = element_text(family = "Verdana")
  ) +
  labs(
    caption = paste(
      "Data: ODE, NCES",
      "Visualization: Antonio R. Vargas (szego.github.io)",
      sep = "\n"
    )
  ) +
  ggtitle("Homelessness in Oregon Public School Districts 2018-2019")

gg_homeless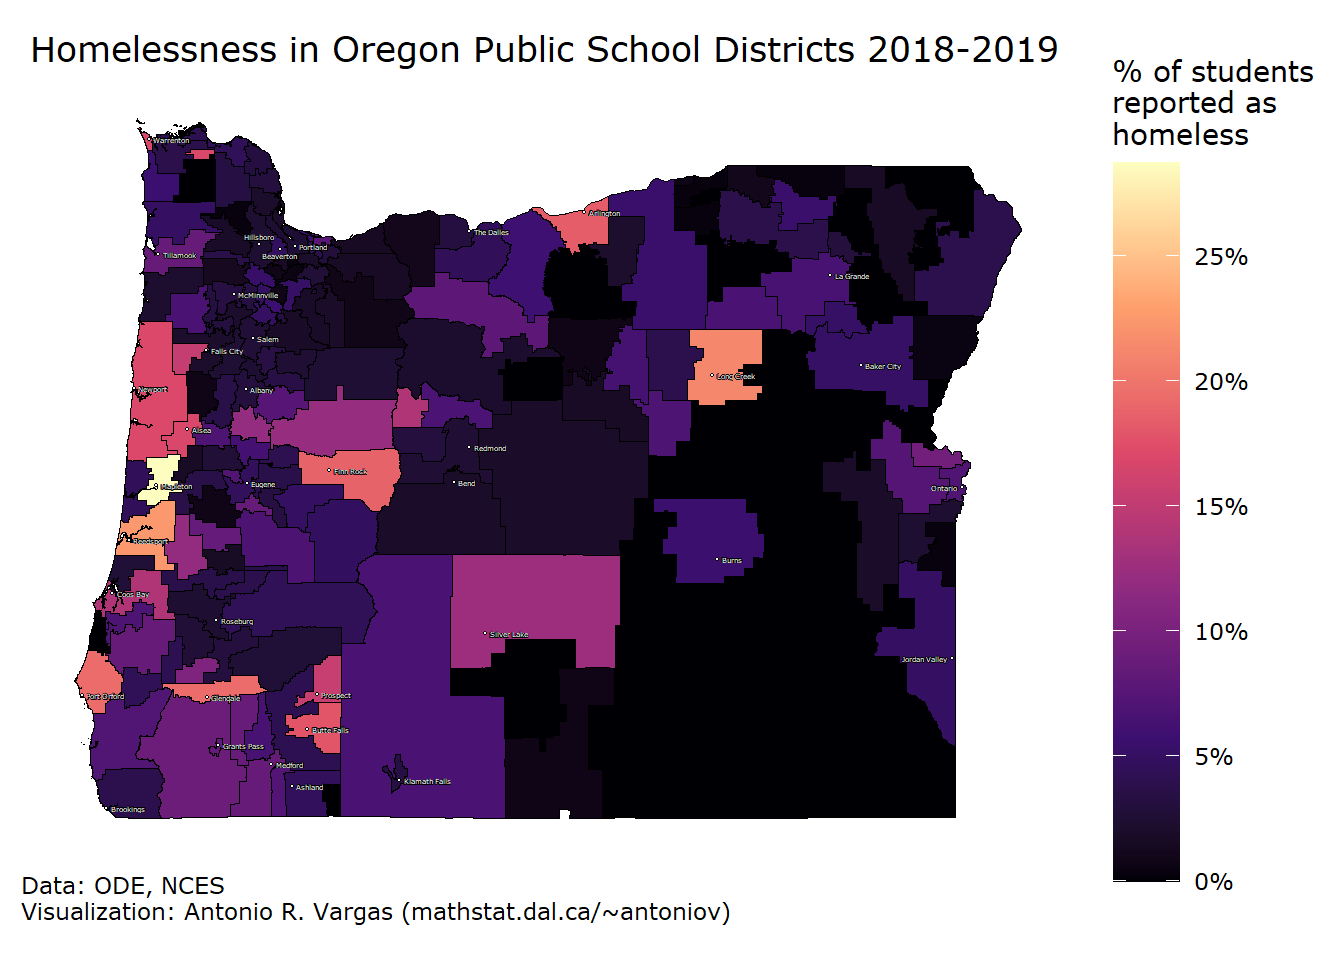
We save the map with a call to ggplot2::ggsave(). In the call I use a haphazard combination of size and scaling parameters that resulted in a nice end product.
4 Acknowledgements
I would like to thank Amelia Vargas for her valuable suggestions and criticism. Thanks also to Dona Bolt at ODE for helping me understand more about how this data was collected.
3 May 2020
These changes aren’t strictly necessary—we could have just accounted for these name changes in the ODE-NCES district names key. However, the ODE names we ended up listing in the key are more similar to district names ODE uses in their other datasets. I think the current ODE-NCES key will be useful for future projects.↩